
The Gender Mosaic Questionnaire / Prof. Daphna Joel
The Gender Mosaic Questionnaire (GMQ) / Prof. Daphna Joel
The aim of the Gender Mosaic Questionnaire is to enable people to discover their own unique gender mosaic* – that is, their unique mix of feminine (more common in women compared to men), neutral (similarly common in women and men), and masculine (more common in men compared to women) characteristics. (To learn more about the gender mosaic concept, click here).
When constructing this questionnaire, we relied mainly on information about gender differences in US samples. The questionnaire includes psychological variables that were found in such samples to show large average differences between women and men (to learn how the size of a difference is estimated, read Gender Differences in Psychology). These variables include job and leisure-time preferences; gender identity as a woman and as a man; self-ascribed femininity and masculinity; sexual preferences and behaviors; partner preferences; and aggression-related measures. However, not all of these variables show large gender differences in other cultures, and some don’t show a large gender difference in our own US sample (the latter reflecting the change in gender norms across time). Therefore, feminine and masculine scores were defined, as descried below, only for variables showing at least a medium gender difference (Cohen’s d > 0.5). For the other variables, all scores were considered gender-neutral.
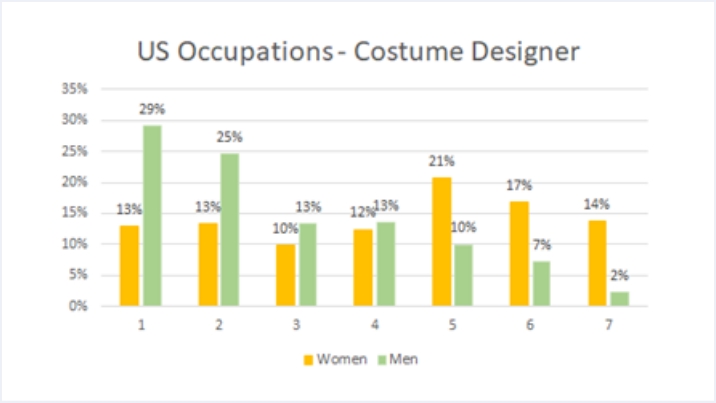
Five ranges of scores were defined for each variable: highly feminine (which appears as red in your personal mosaic, see figure), slightly feminine (pink), neutral (yellow), slightly masculine (light blue), and highly masculine (blue). To learn how we defined each of the five, let’s have a look at the answers that 1,500 men (green) and women (yellow) in the US sample gave to the question, “How much would you enjoy being a costume designer?” Their response options ranged from “Strongly dislike” (1) to “Strongly like” (7).
We started out by identifying the Neutral zone of scores: scores 3 and 4 in the figure below. These are the scores for which the percent of female and male respondents is very similar.
The masculine and feminine regions are below and above the Neutral zone, respectively. To divide each of them into “Highly masculine/feminine” and “Slightly masculine/feminine,” we used the following rule:
Starting from the lowest possible score, the “Highly masculine” range of scores comprises the scores that were cumulatively selected by approximately 33% of men (score 1 in the example). The remaining ones comprise the “Slightly masculine” range of scores (score 2 in the example).
Similarly, starting from the highest possible score, the “Highly feminine” range of scores comprises the scores that were cumulatively selected by approximately 33% of women (scores 6 and 7 in the example). The remaining ones comprise the “Slightly feminine” range of scores (score 5 in the example).
Clearly, what’s feminine and what’s masculine varies from one culture to another, which means that whether there is a gender difference, how large it is, and which scores would be considered feminine and which masculine, would differ in different cultures. (To learn more about how gender differences vary by culture, check out Cultural Differences in What’s Feminine and What’s Masculine.) In the default output of the questionnaire, feminine and masculine scores are defined according to the US sample.
After you complete the questionnaire, the software compares your scores on each variable to a table that has the five ranges of scores, and creates your personal gender mosaic in comparison to the US sample. For example, if you chose a relatively high score, say, 5, to the question, “How much would you enjoy being a costume designer?”, the corresponding square in your mosaic would be pink (slightly feminine); if, on the other hand, you chose the lowest score, 1, the square would be blue (highly masculine); and if you chose an intermediate score, say, 4, the square would be yellow (gender neutral). The squares representing all the variables with a gender difference smaller than 0.5 in the US sample, would also be yellow.
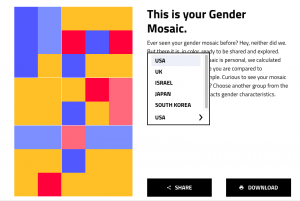
Next, you can watch your mosaic using definitions of femininity and masculinity according to additional reference groups, some gathered in advance (for example, representative samples from the UK, Israel, South Korea, and Japan), and others that we keep creating on an ongoing basis from respondents filling out the questionnaire on this website (for example, people 18-26 years old). If you now choose a different reference group, the software will compare your scores to a different table, containing the five ranges of scores for each variable computed according to your choice of reference group. Because gender differences may vary across cultures, some of the squares in your personal gender mosaic are likely to change their color, while others won’t.
You can then choose yet another reference group, and see how your personal mosaic changes again. You can repeat this as many times as you wish. And if you want, you can sign up (at the bottom of the page) to receive our updates, and we’ll let you know when new reference groups become available (just make sure you keep the code you receive when you finish filling out the questionnaire).
*The Gender mosaic visualization concept & design were created by Noa Simcha as a part of the Data Visualization course led by Roni Levit, 2020, at the Bezalel Academy of Arts and Design, Jerusalem, Israel.